Advanced UpSet Features
In addition to the basic UpSet feature of visualizing set intersections, there are more advanced analysis questions that UpSet can help answer.
Visualizing Attributes
In addition to set memberships of items, it is frequently useful to also visualize attributes about the items in intersections. We could use this to, for example, compare properties of two intersections, e.g., to compare ratings of movies in the “Adventure” genre with movies in the ”Documentary” genre. UpSet plots can visualize attributes in two ways: inline, or in separate views.
Inline Attribute Visualization
Inline attribute visualization makes it easy to make comparisons across all intersections that are currently shown. The idea is to simply plot an aggregate visualization, such as a box plot, a dot plot (strip plot), or a violin chart next to the bar that shows the size of the intersection. Below you see an example comparing the average ratings of movies that are in various genres.
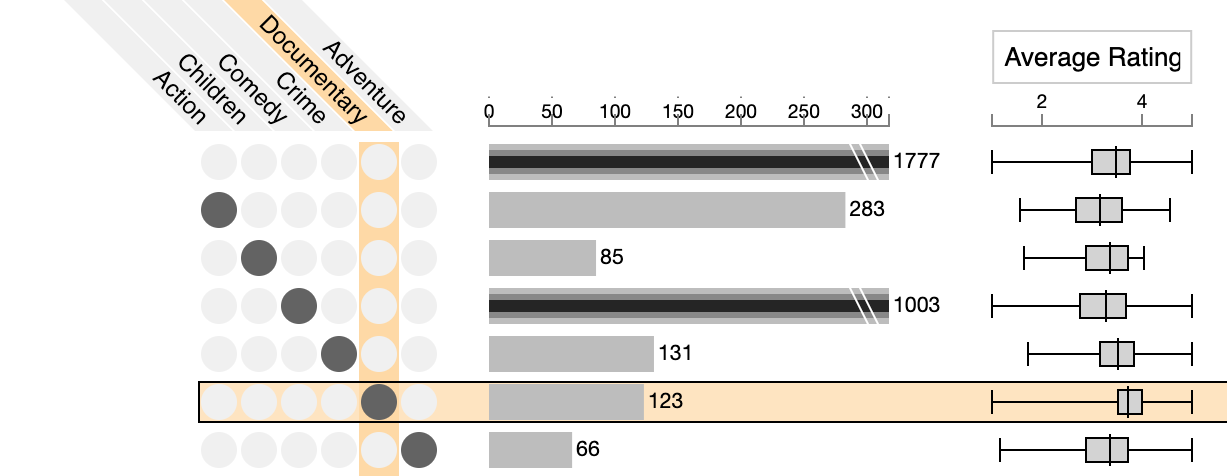
Here we can see that the average rating for documentaries is higher than for the other genres. Ideally, an upset implementation can also sort the intersections based on these attributes.
Attributes in Separate Views
Additional attributes can be visualized for selections in separate views, for example, in scatterplots or histograms. The figure below shows two selections, a blue one, for “Documentary” moves, and an orange one for “Adventure” moves. A scatterplot shows average ratings versus release date for these two genres. Again, we see that documentaries have higher ratings, but also have only been produced more recently. The blue selection is active, we see a full table of items of it.
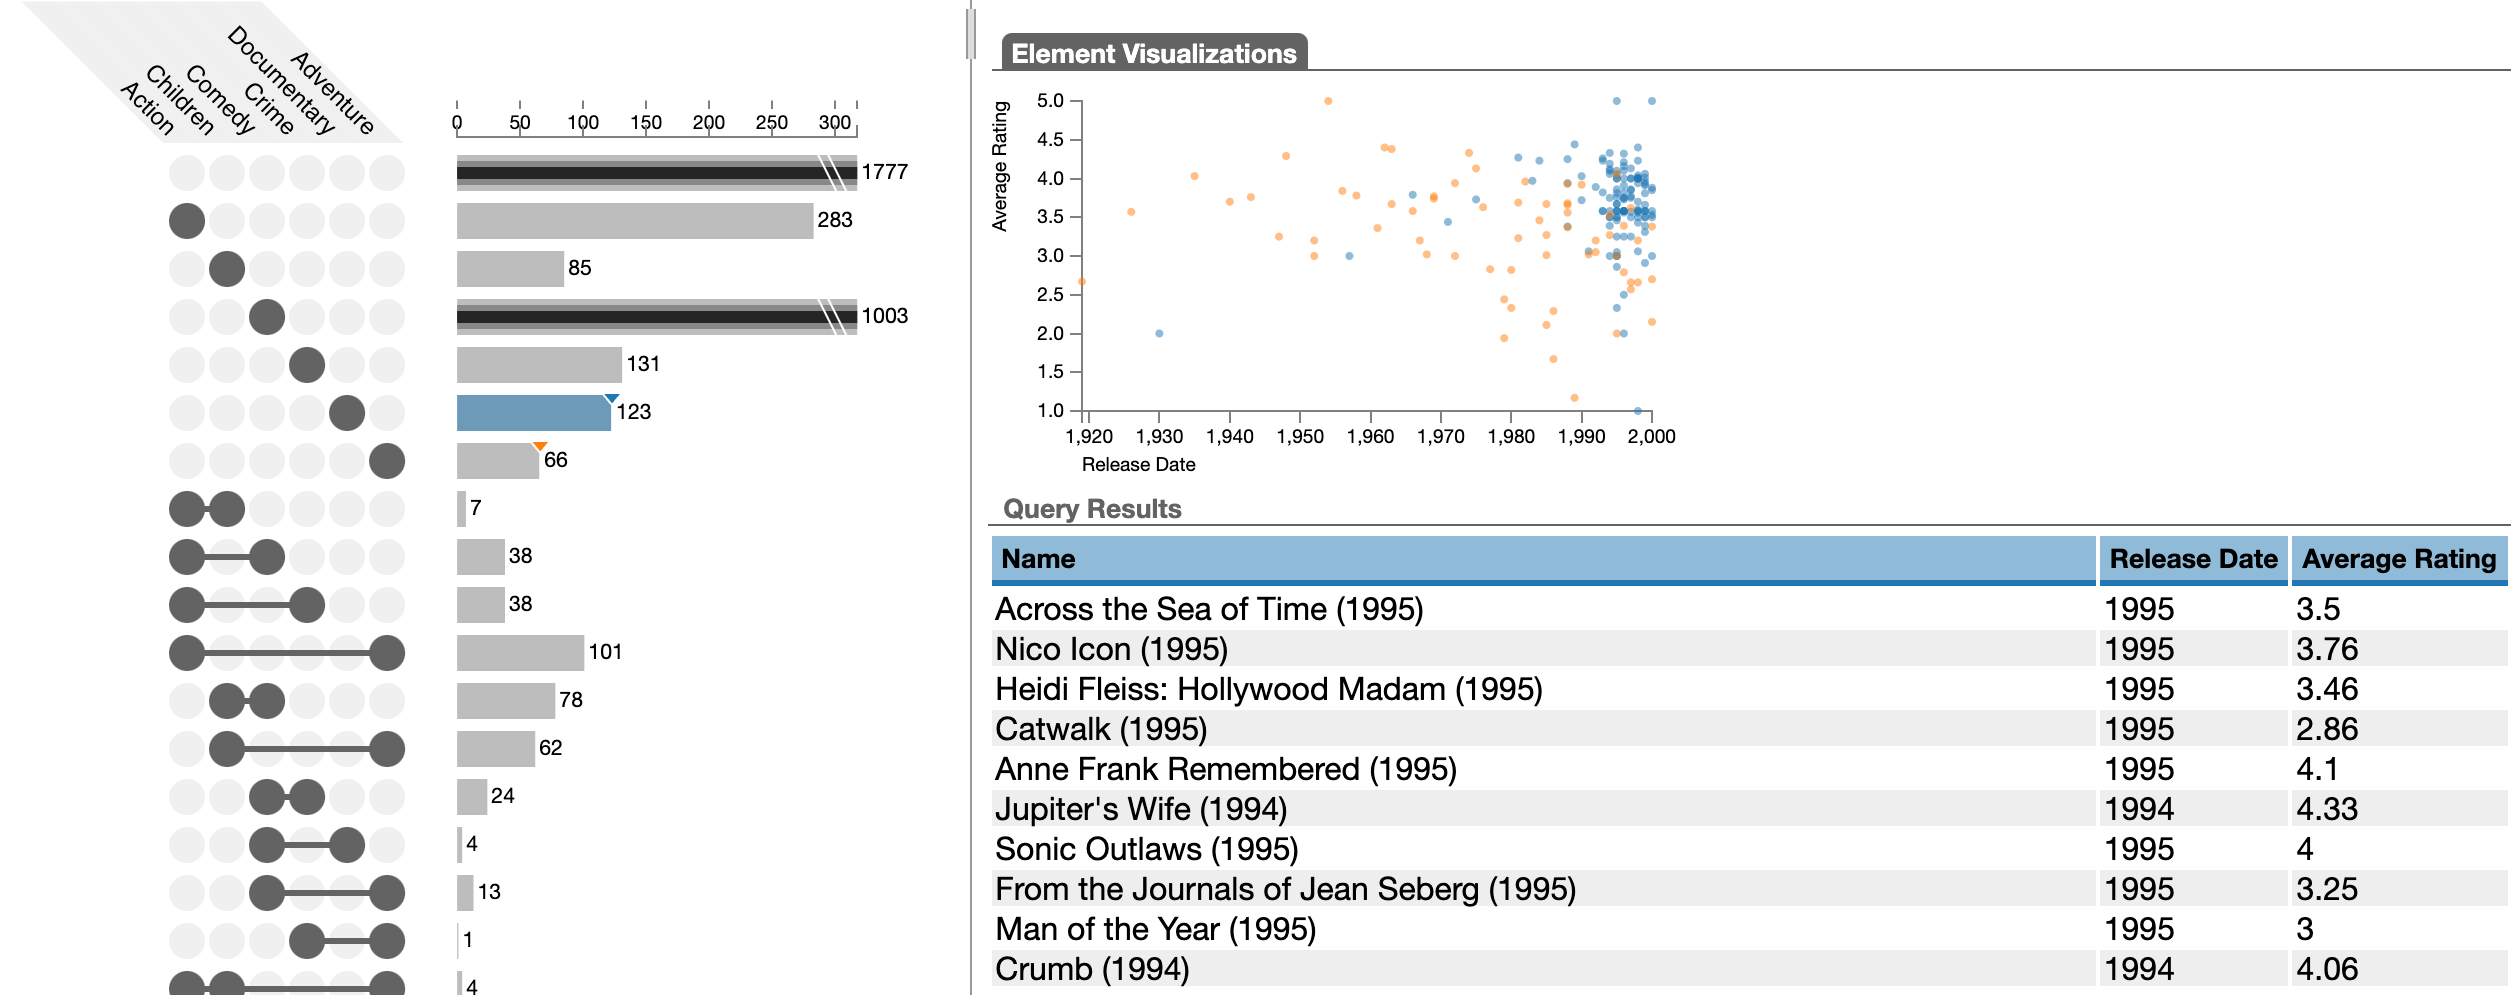
Different UpSet implementations allow different approaches for selecting and exporting these items.
Visualizing Deviations
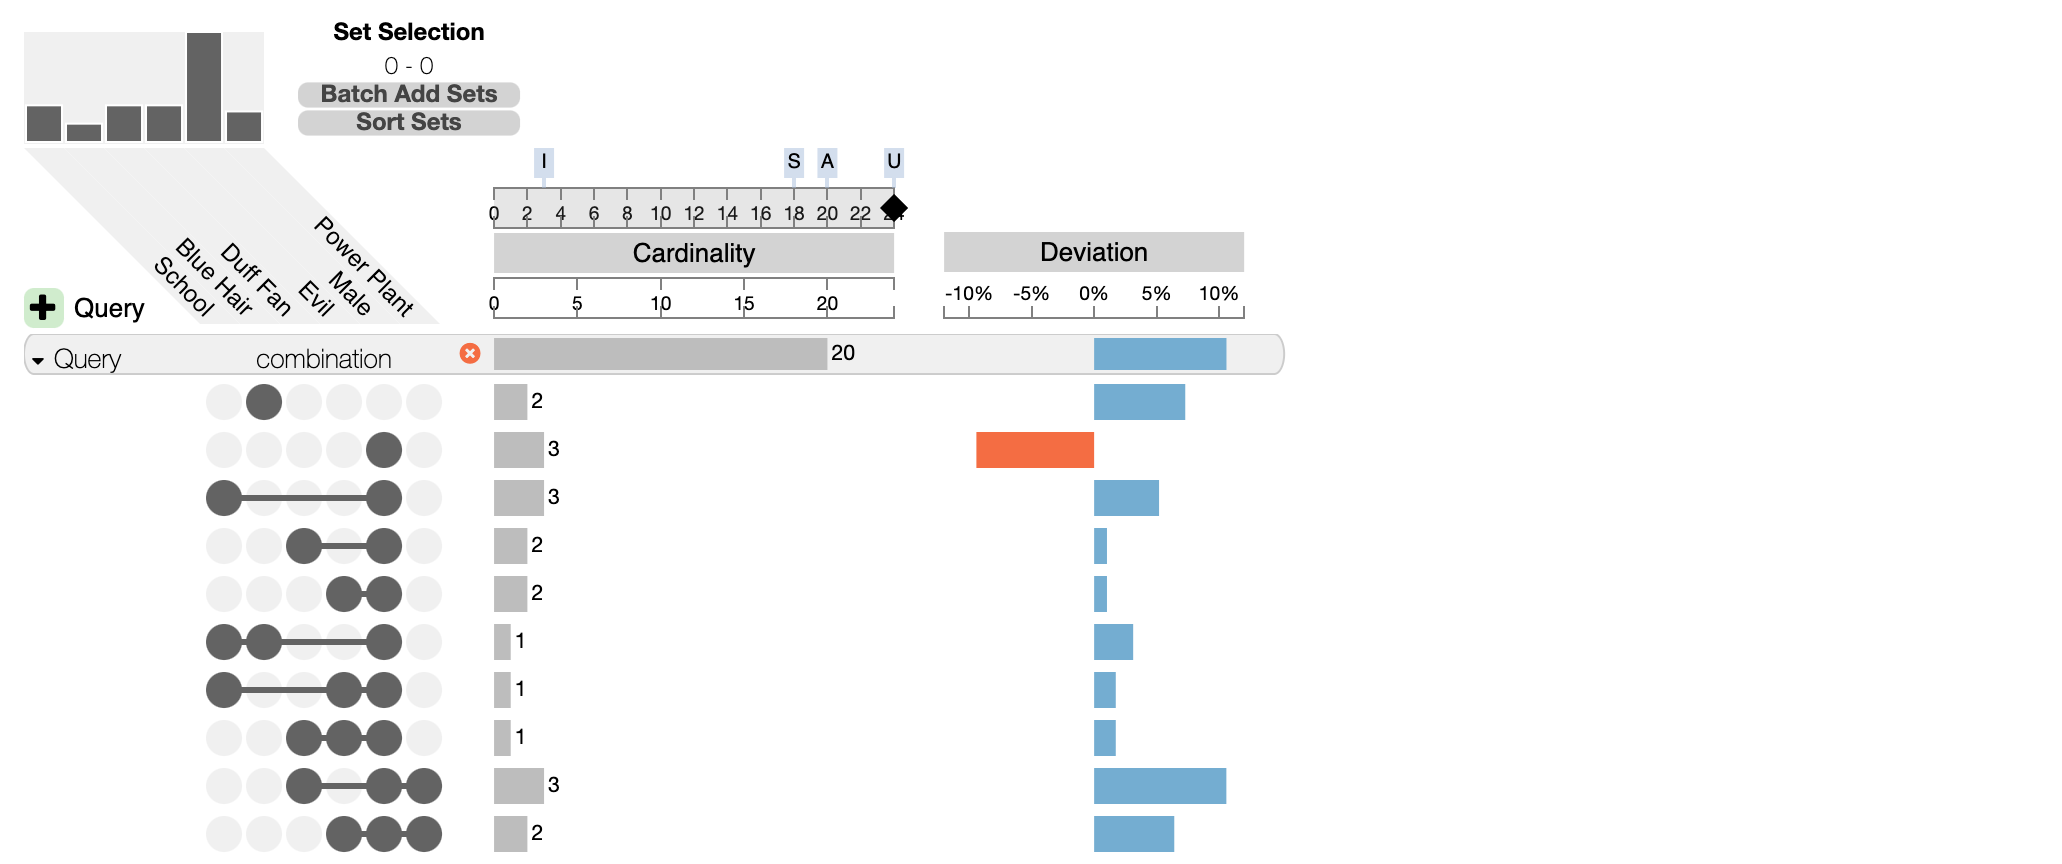
As discussed in the Interpreting UpSet section, we must be careful interpreting UpSet plots when the set sizes deviate a lot.
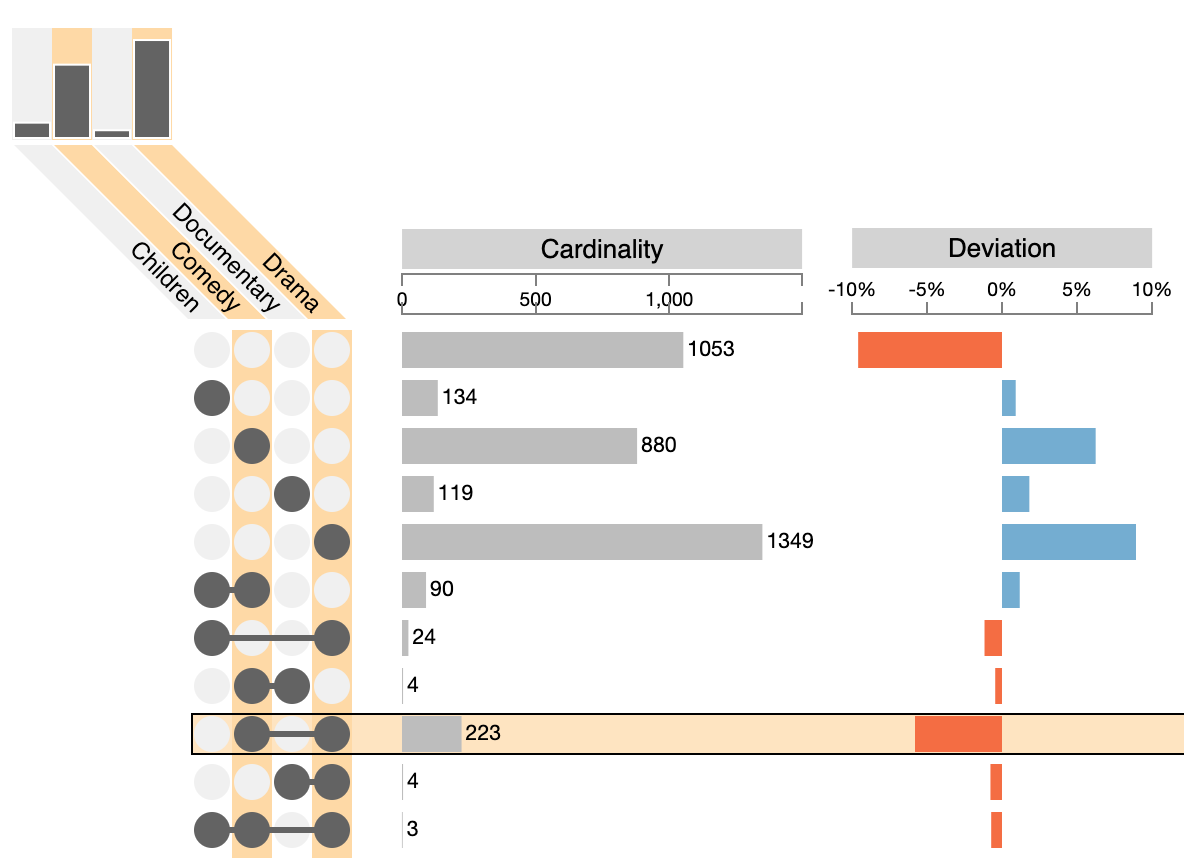
The 2-set combination of “Drama” and “Comedy” is the largest two-set intersection, yet this is caused only by these two sets being very large to begin with. To address this, it is possible to shows metrics that indicate how much an intersection deviates from the expected size. In the example, we see that the comedy-drama intersection is actually much smaller than it should be if the data were random.
Aggregation & Grouping
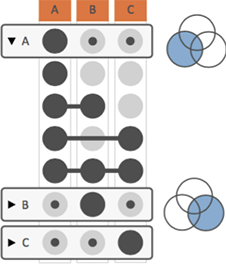 In many cases, analysts are interested in understanding more complex set relationships than just individual intersections. UpSet addresses this by making use of aggregations. Aggregations summarize multiple intersection that share a trait. The figure on the right shows an aggregation by sets: group all intersections that contain a set. Note the extra row labeled “A” - it summarizes all of the intersections where A participates, as shown in the corresponding Venn diagram. These aggregations can show data (size, attributes) just the same way as individual intersections can. Furthermore, aggregates can be collapsed, to hide the intersections that make up the aggregate, as is the case for B and C in the figure. Note that aggregations can result in intersections being contained in multiple aggregates.
UpSet plots can be aggregated in various ways, we show a few common variations below.
Aggregate by Sets
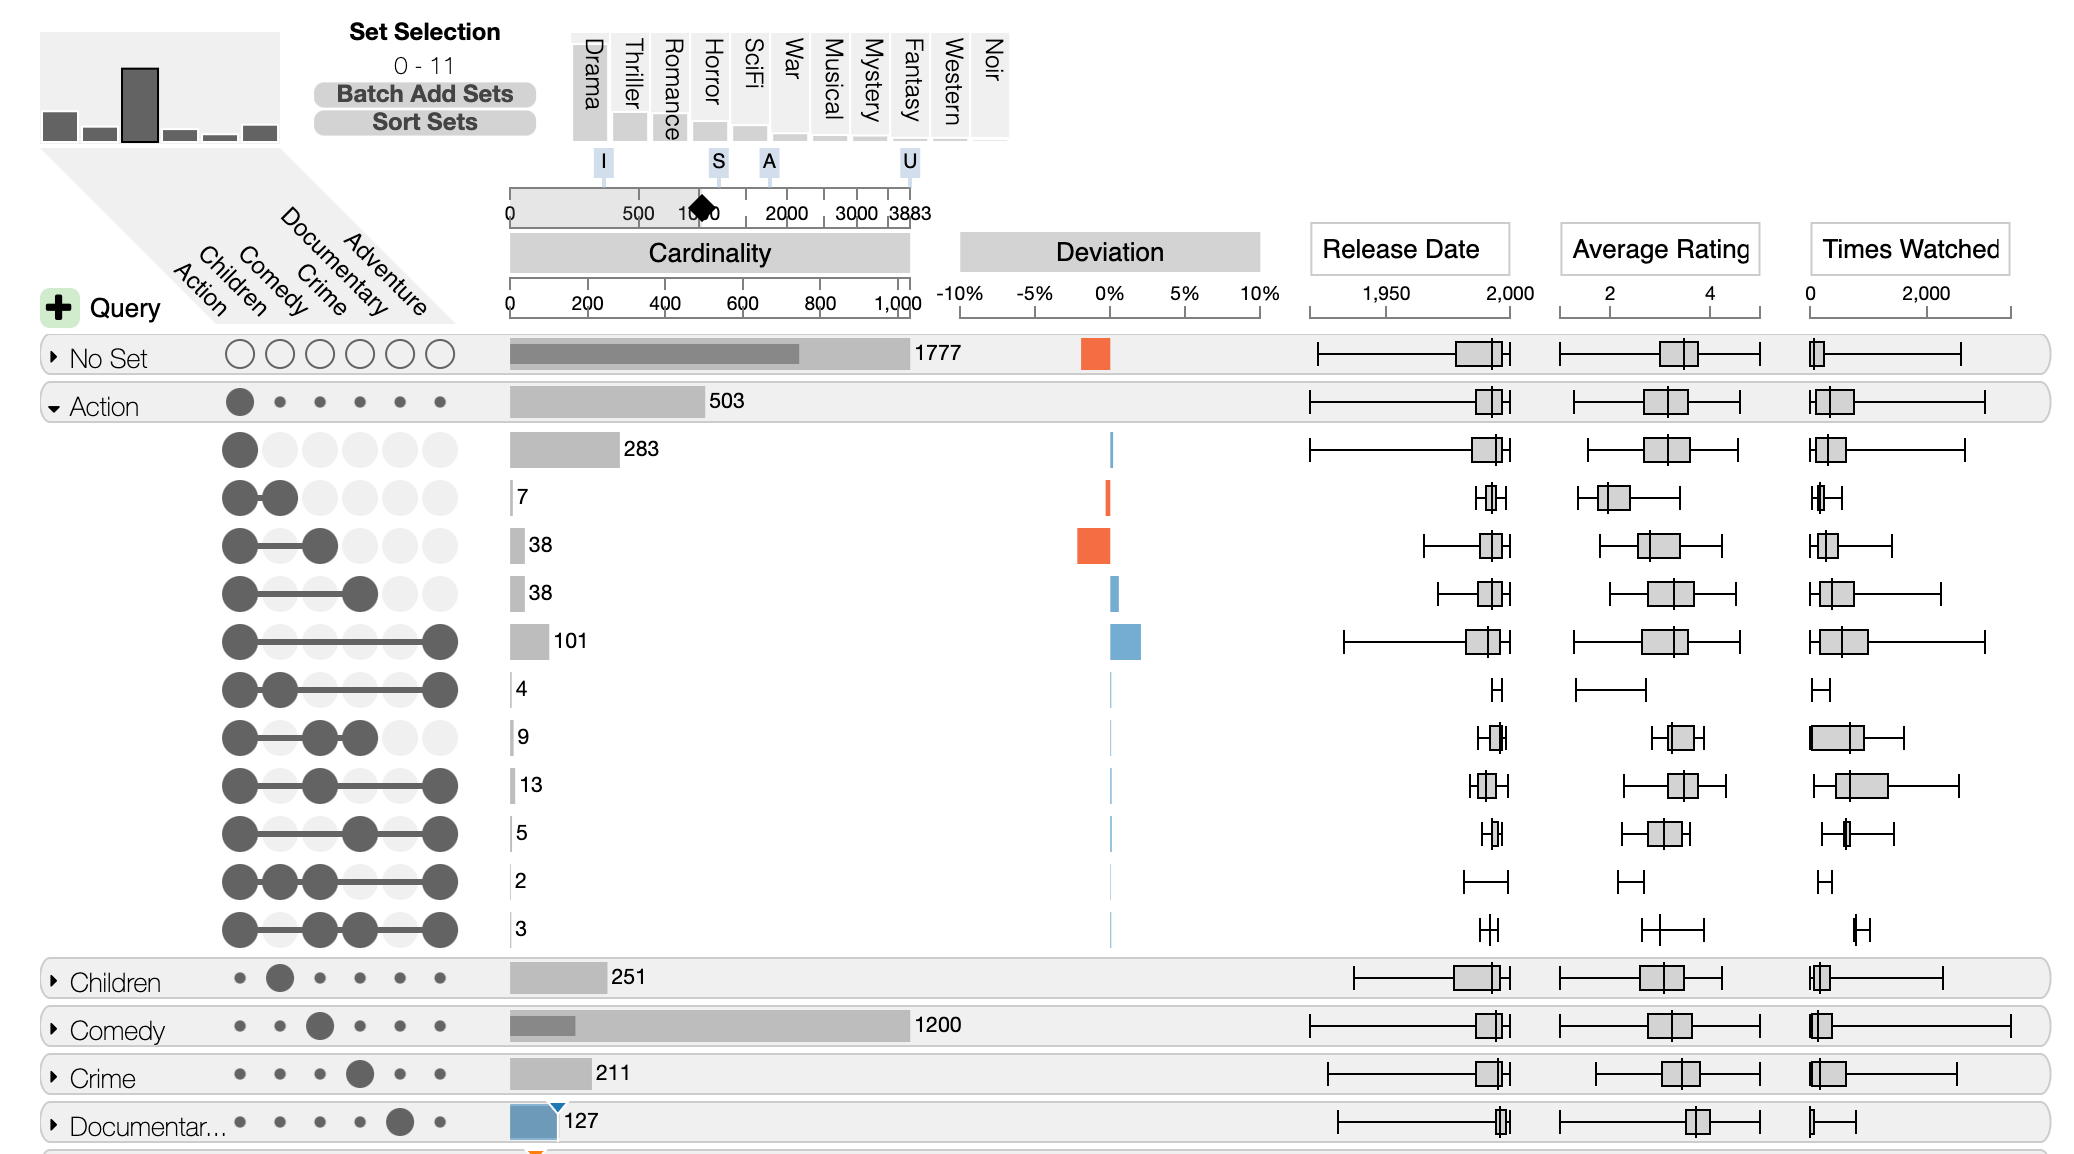
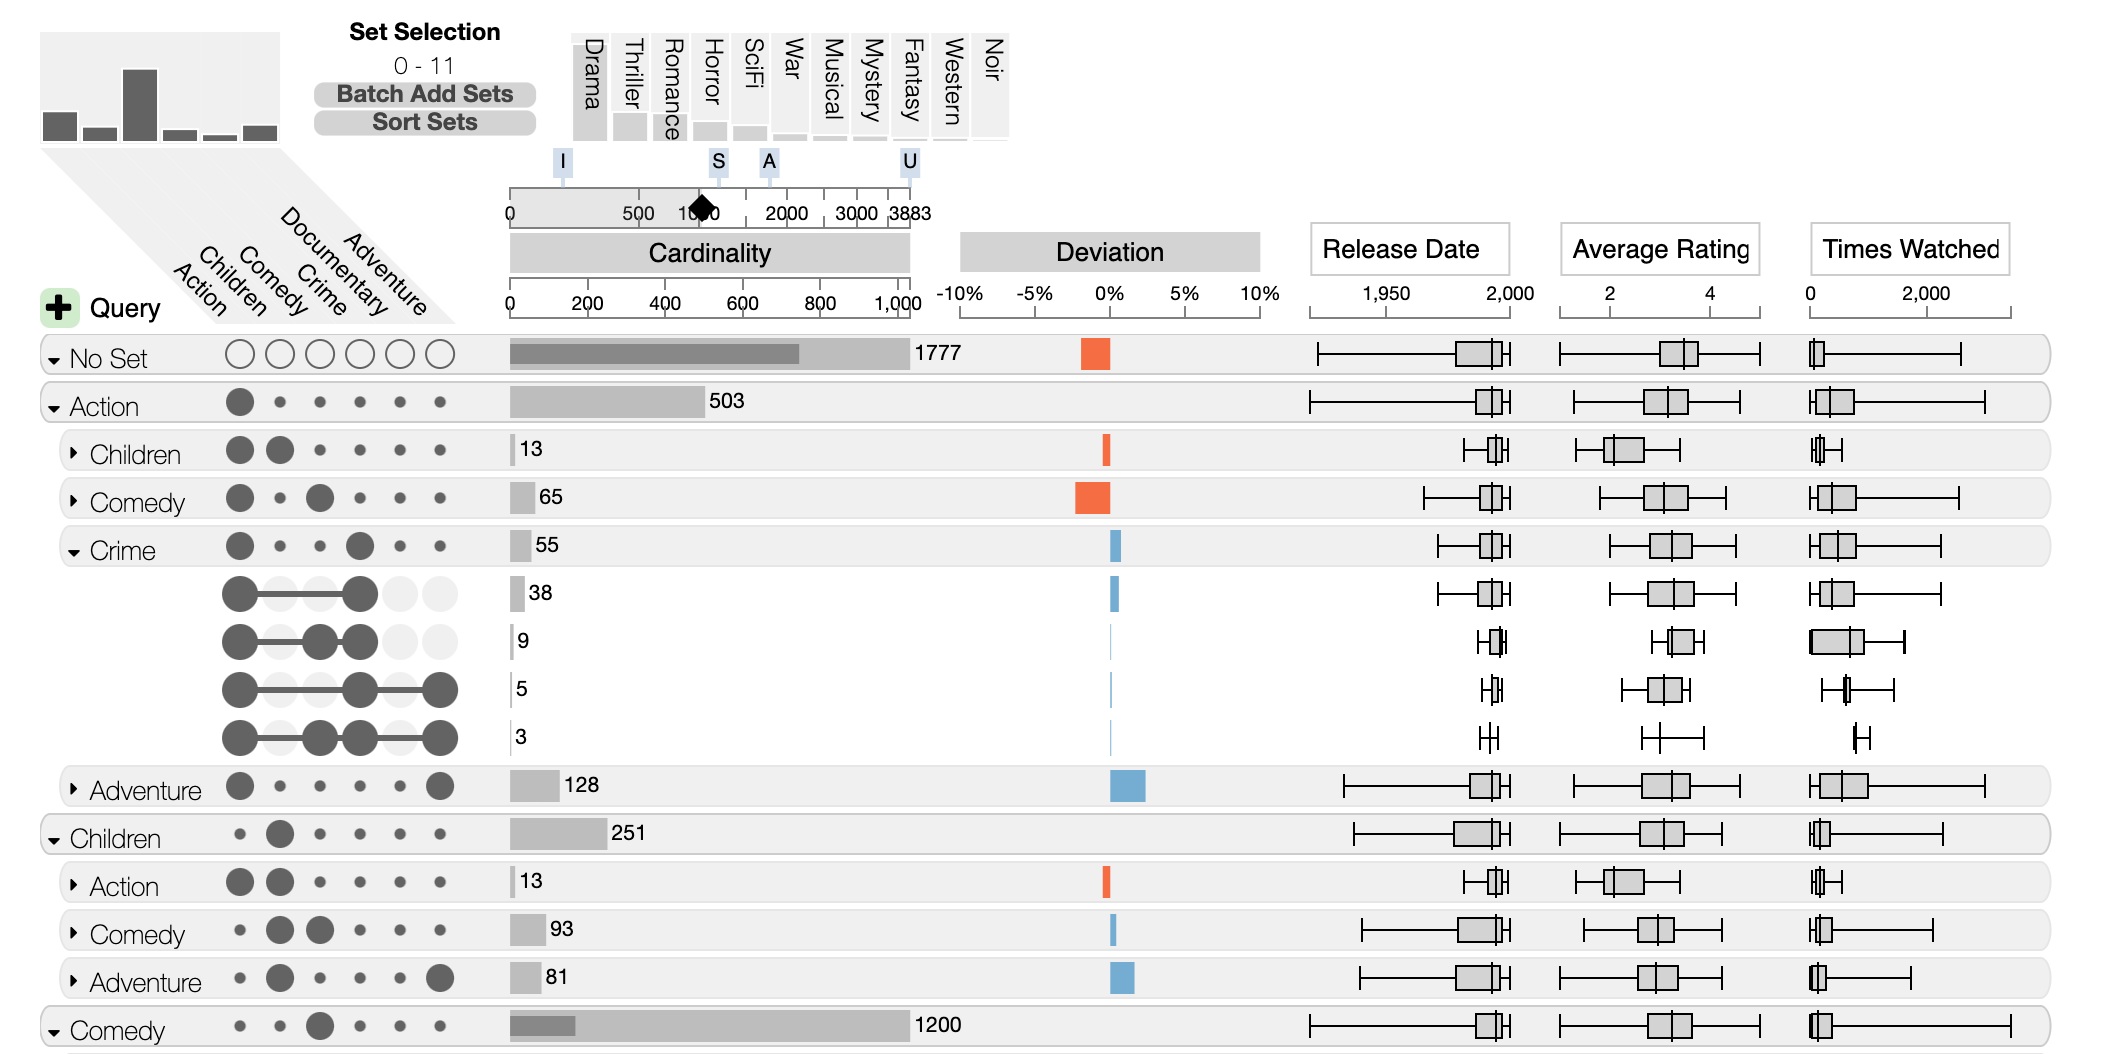
Aggregation by sets gives a nice overview of the properties of the set, and selectively un-collapsing, as done for the “Action” genre here, enables analysts to inspect the composition of individual sets.
Aggregate by Degree
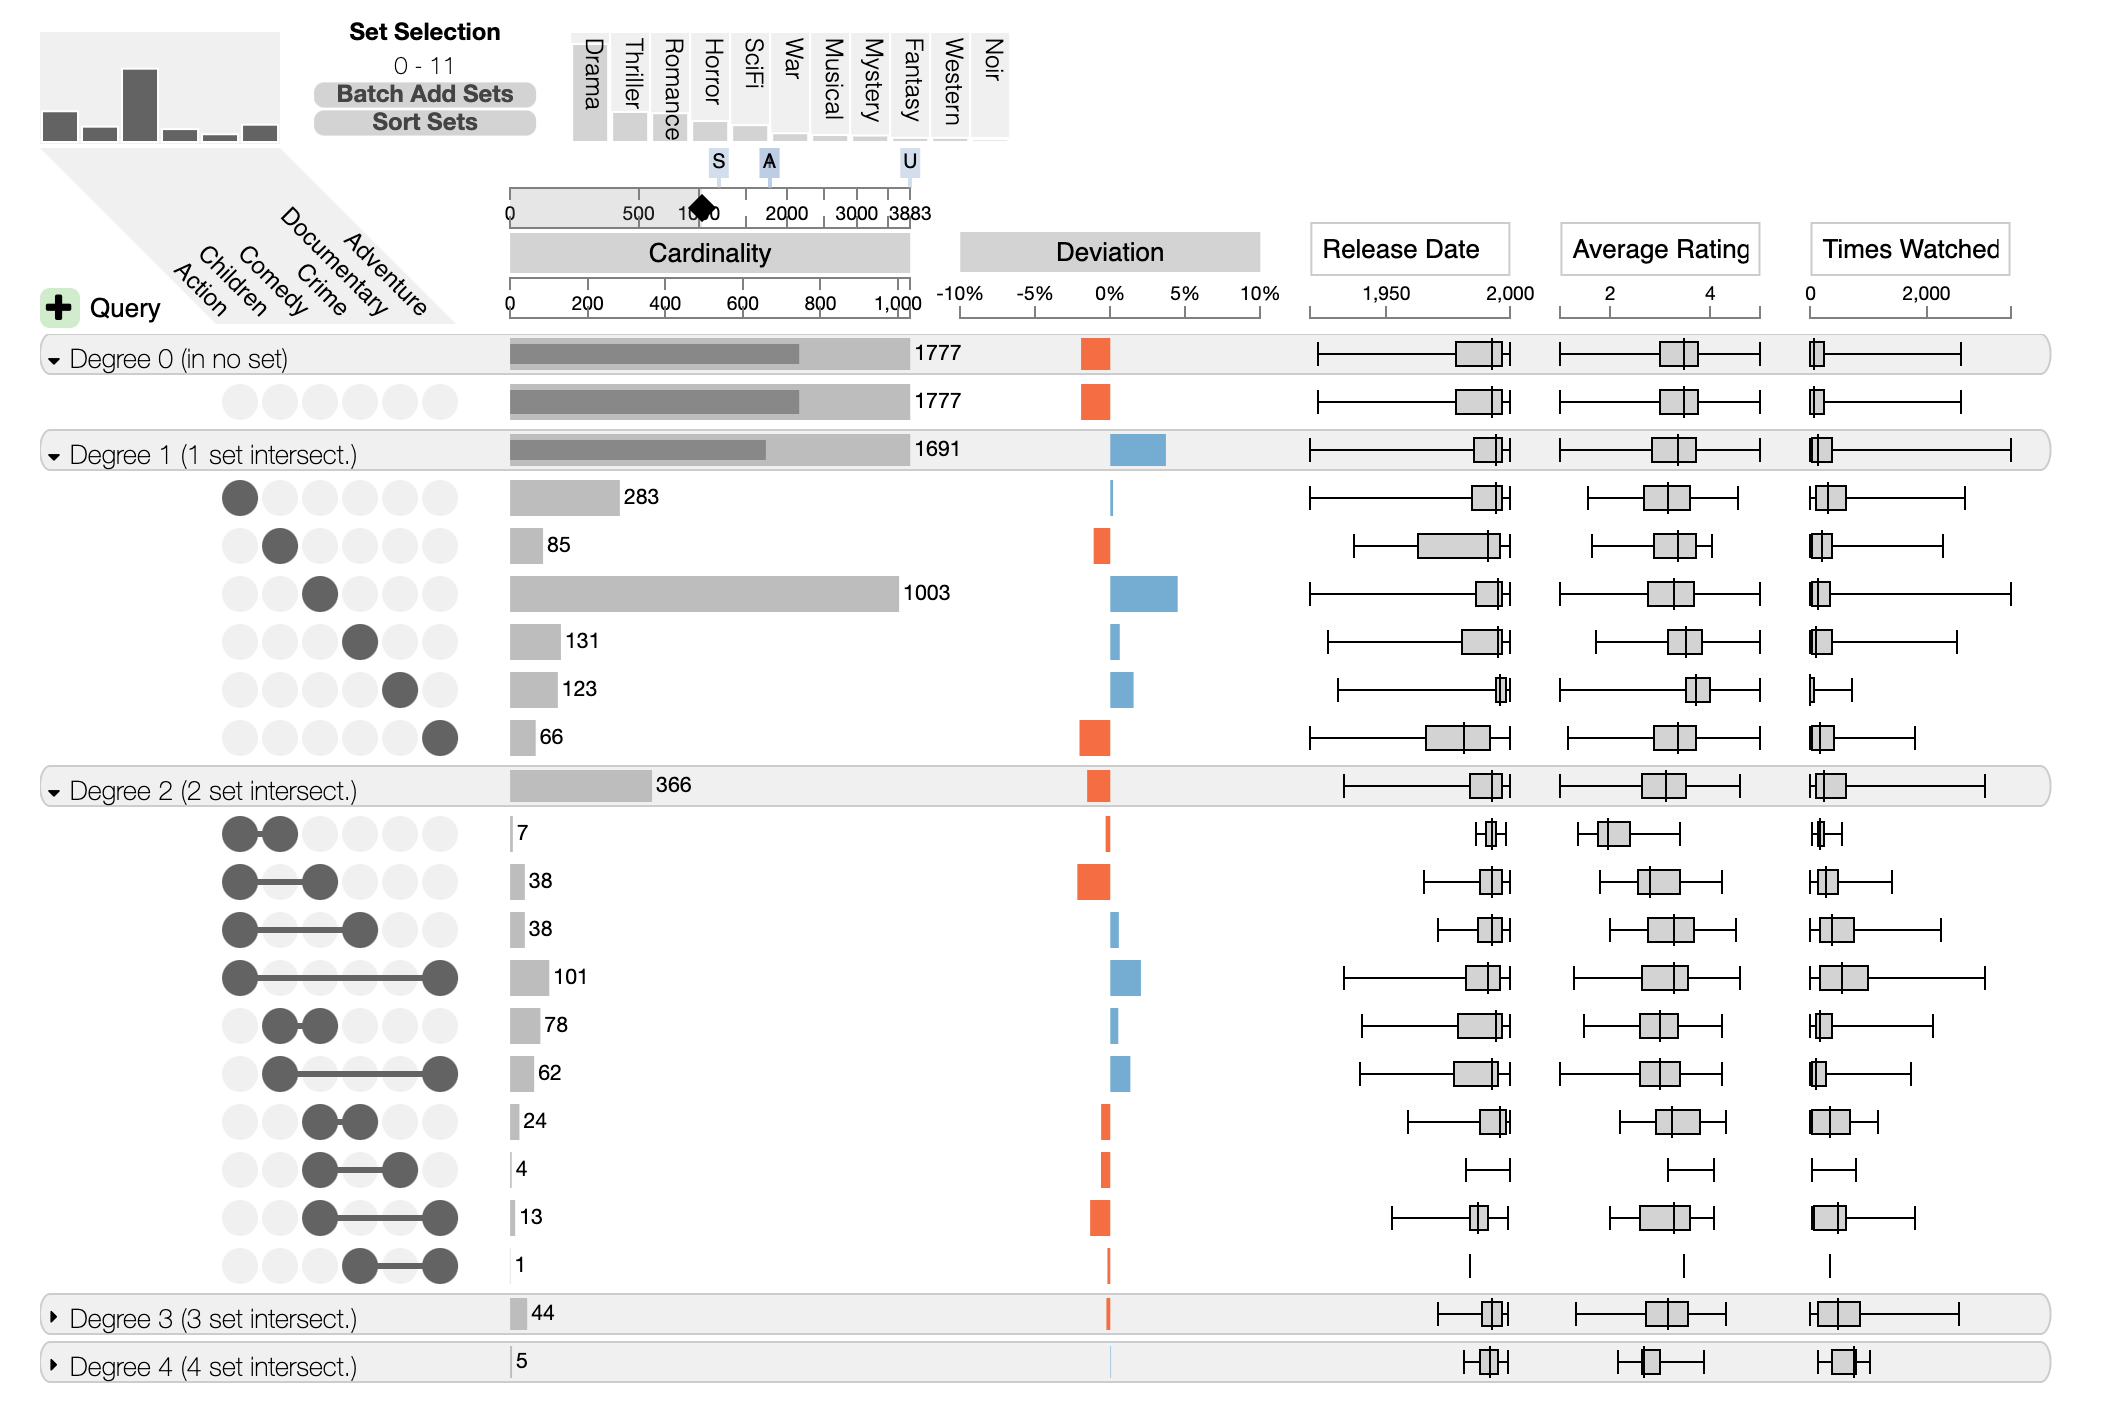
Aggregation by degree is an efficient method to inspect whether most items are part of none, one, two or more other sets.
Nested Aggregation
Nested aggregation is an advanced approach that is most useful to see pairwise overlaps between sets. In the above screenshot, the first level of aggregation is sets, the second is overlaps (all intersections that overlap between two sets). Combined, this results in a view that lets analysts efficiently analyze which sets interact with each other.
Queries
A concept closely related to aggregation is querying; querying
Querying for Items
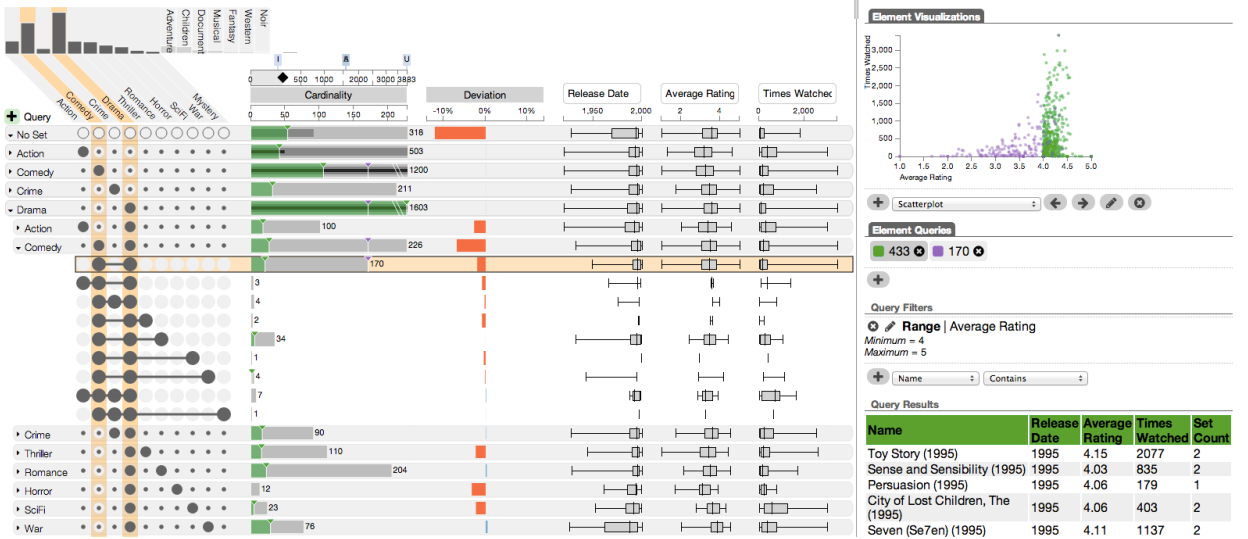
Items can be queried by some attribute, and the distribution of these items across intersections can be shown. The example below shows a query for movies with an average rating between 4 and 5 in green.
Querying for Intersections
It’s equally possible to define a group of intersections that must, may, or must not include a specific set. The query in the following picture defines a subset of Simpsons characters that are either exclusively male or that have blue hair and aren’t male. The first part of the query (first row) is indicated by two empty circles in the evil and blue hair cells. This part is combined as an “or” with the second part, that is set to “must” for blue hair, “may” for evil and “must not” for male.
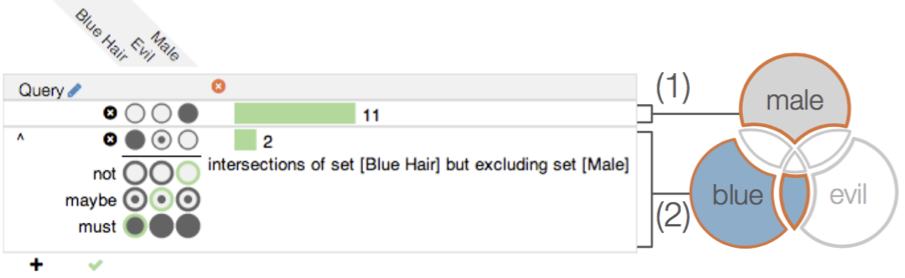
The result is a group of all intersection that match the query:
UpSet Data Formats
UpSet plots can generally consume three different data formats: tabular, lists, and set-expressions. Tabular is the most expressive format, but the other formats can be useful in some contexts.
Tabular
The tabular expression comes with a list of items, and a binary matrix (one-hot encoding) of set membership. Additional attributes can be added as extra columns.
Here’s an example:
| Name | School | Blue Hair | Male | Power Plant | Age |
|---|---|---|---|---|---|
| Lisa | 1 | 0 | 0 | 0 | 8 |
| Bart | 1 | 0 | 1 | 0 | 10 |
| Homer | 0 | 0 | 1 | 1 | 40 |
| Marge | 0 | 1 | 0 | 0 | 36 |
| Maggie | 0 | 0 | 0 | 0 | 1 |
| Mr Burns | 0 | 0 | 1 | 1 | 90 |
School, Blue Hair, Male, and Power Plant are set columns, Age is an attribute column.
Lists
Lists explicitly list the sets and which items are in the set. For example:
School: Lisa, Bart
Blue Hair: Marge
Male: Bart, Homer, Mr Burns
Power Plant: Homer, Mr Burns
There is no standard way to handle attributes in this case.
Set-Expressions
Finally, set-expression explicitly specify the size of each intersection:
School: 1, School&Male: 1, Male&Power Plant: 2, Blue-Hair: 1
Set-Expressions can’t handle attributes. In fact, they don’t even have information about the items.